The patches belonging to this project can be downloaded from the Cycling 74 website, in this link:
By using the pfft object in Max MSP I created simple video source of 50 by 50 pixels (50×50 matrix) so it can be used as a control for a LED matrix of the same dimensions.
The process if very simple, by generating a subpatch with pfft, you can get the frequency bin that is being processed at the moment with fftin~, using the sound coming from the computer’s microphone. And from the same object you take the real and imaginary parts of the spectral analysis, with which you can get the amplitude and phase of such bin.
fftinfo~ gives you information about the current subpatch used by pfft~. So I took the Spectral Frame Size so to know the number of bins used by Max.
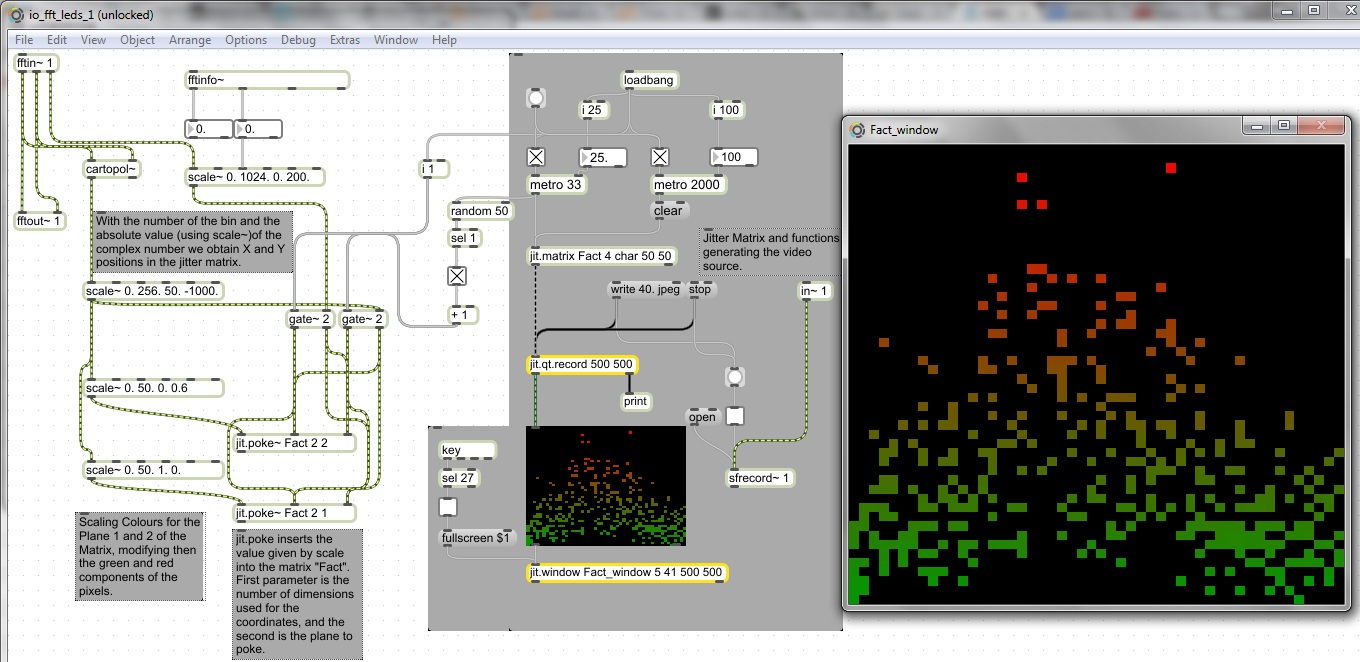
These numbers are given as signal streams, so they need to be processed with objects with the ~ symbol. And, by scaling them to a the desired range I used the jit.poke object to take this frequency analysis and modify pixels in a a jit.matrix. So, this matrix it displays a spectrogram with standard green to red colours, depending on the amplitude.
The scaling is as such because of the levels of the microphone, volume of the source, active frequency bins, etc. i.e. the frequencies on the upper side of the spectrum showed no activity so I discarded them from the final video output.
The right side of the patch contains the jitter components of the application, creating a matrix of 50 by 50, metro objects to draw and clear the screen, full screen and video and sound recording functions.
There is also some gate~ objects so that the X and Y coordinates are swapped and the visualization of the spectrogram changes from vertical to horizontal… just for the sake of it.
As I said, this low resolution video output is intended to control a large LEDs matrix of the same dimensions on the façade of a building, hence its simplicity.
Good for using in parties!